
cloudprober.org | Start Monitoring Now
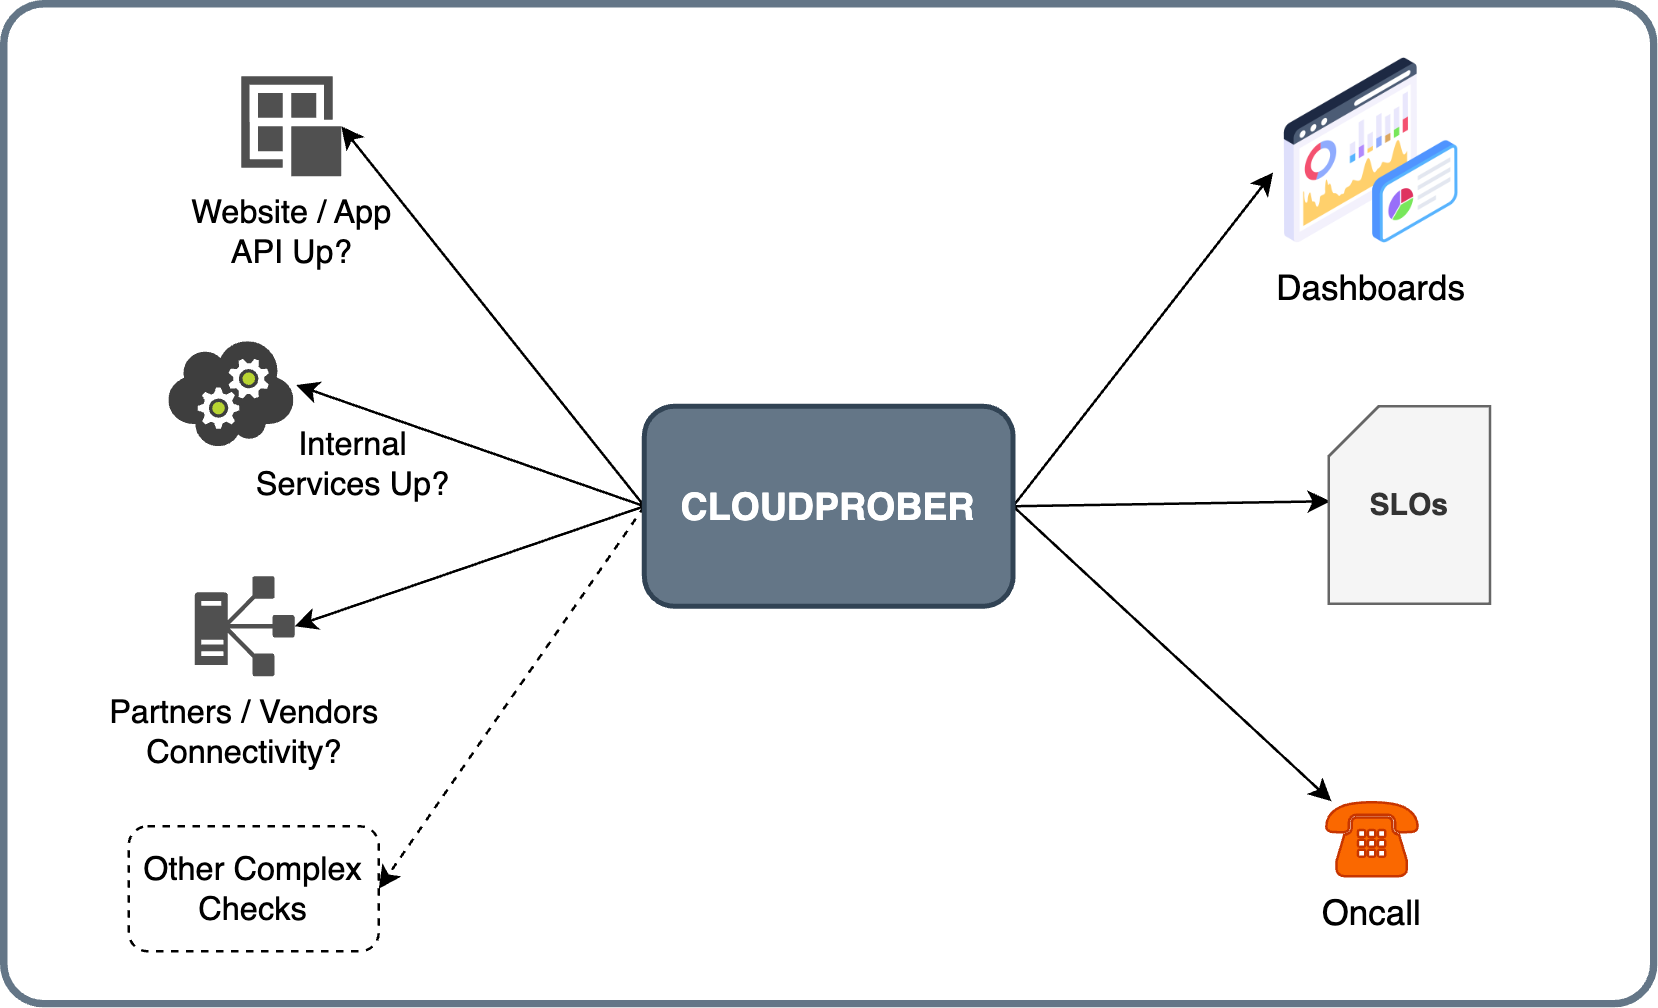
Cloudprober supercharges your monitoring with active probes (a.k.a. synthetic monitoring) to ensure your systems—homelabs, microservices, APIs, websites, or cloud-to-on-prem connections—run smoothly. See this post for why probers provide one of the most reliable monitoring signals.
-
Versatile Probes: Built-in HTTP, PING, TCP, DNS, gRPC, and UDP probes, plus custom checks via external probes.
-
Auto-Discover Targets: Effortlessly monitor Kubernetes, GCP, or file-based resources without constant redeployment.
-
Integrate with Existing Systems: Out-of-the-box integration with Prometheus, Grafana, DataDog, AWS CloudWatch, PostgreSQL, and Google Cloud Monitoring.
-
Easy Alerts: Stay informed via email, Slack, PagerDuty, OpsGenie, or any other HTTP based system.
-
Lightweight & Scalable: Written in Go, compiles to a single binary, and runs efficiently as a standalone app or Docker container.
-
Custom Metrics: Flexible latency histograms and configurable labels for precise insights.
-
Extensible: Easily add new probe types, targets, or monitoring systems.
Jump in with our Getting Started guide and start monitoring your systems in minutes.
Join our Slack, or discuss on Github. Help shape Cloudprober's future by commenting here.
NOTE: Cloudprober's active development moved from
google/cloudprober to
cloudprober/cloudprober in
Nov, 2021. We lost a bunch of Github stars (1400) in the process. See
story of cloudprober
to learn more about the history of Cloudprober.