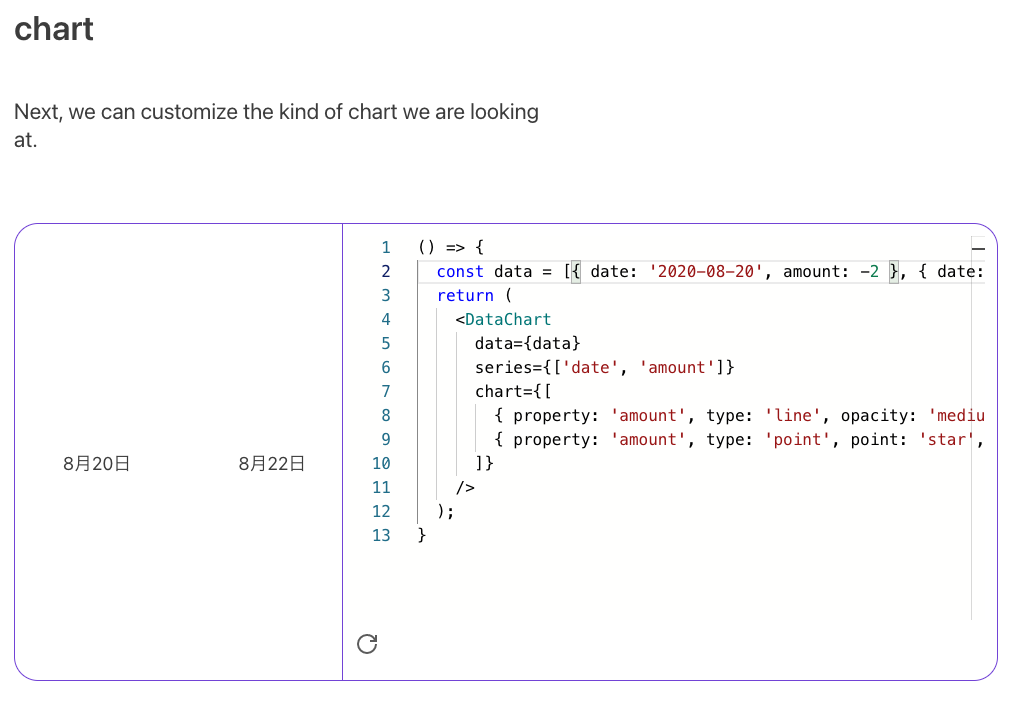
<!--- Provide a general summary of the issue in the Title above --> DataChart cannot render bars when data includes a negative value. ### Expected Behavior <!--- Tell us what should happen --> - If data has some negative value, the chart will have a zero line guide as default. - I wish we can custom attributes(colors) of negative value. ### Actual Behavior <!--- Tell us what happens instead --> - A chart shows nothing. ### URL, screen shot, or Codepen exhibiting the issue <!-- -- Here's a Codesandbox template that serves as a nice starting point -- for demonstrating an issue: https://codesandbox.io/s/m7mml8l0zj -->   ### Steps to Reproduce https://v2.grommet.io/datachart?c=BQSgBAvAfGDeBQYwGMD2A7AzgFzAEwENsDIwBtWfIgUwC4wByAJgAZWBaFgDndYYBowBALaoArumz1eYAL6DKhbHUasO3XgEYBQ0RKlgALAHY5CqsvrM2LTjyZMdI8ZPoBmN3IC6AbkRgAJ2psMQD0MGB-JAAeABEiAgBhAAsCAOwopAsCCFglAllMpExqAIBLakxcsgYlah0GZ30GL0KsrORU9OqirMoABwDUftLsAE8rJskdcZGrABsy9HrBYYJkMvGrYWo8MrFhGeSy5ABrZcxMKwAPTGECefmdIYk8M16kAaGR9InGKewMzGc0Y-VQS0BgjBEKsODSRxO50qV0YOz2BwYcl6rUyAHooP4QH5ZEA ### Your Environment <!--- Include as many relevant details about the environment you experienced the bug in --> - Grommet version: 2.4.0 - Browser Name and version: Chrome - Operating System and version (desktop or mobile): Mac